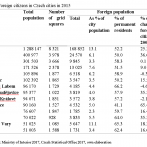
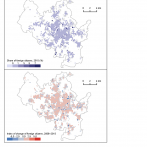
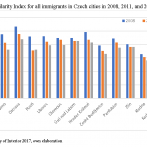
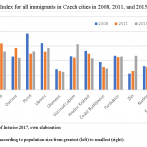
Immigration is one of the most contentious fields of contemporary European urban policy. While the development of urban segregation is well documented in traditional immigration countries with population register data, there is a lack of detailed research on population dynamics in many countries and cities across Europe. This article examines ethnic residential segregation in Czechia in the period after the economic crisis of 2008. Special attention is paid to the trajectories of individual cities and their position in the urban hierarchy. Longitudinal population register data are used and segregation indicators of unevenness and exposure are computed for the largest cities using a detailed spatial grid. The results show a broad picture of decreasing segregation despite the continuously growing number of immigrants in the country. While the economic crisis temporarily halted immigration, the spatial patterns of immigrant dissimilarity did not change and more-established immigration gateway cities experienced an increase in spatial isolation. In the conclusion, the article calls for further discussion on ethnic residential segregation in post-socialist cities.
impaktovaný článek
Šimon, Martin, Křížková, Ivana, Klsák, Adam. 2021. „New urban diversity at and after the economic downturn: recent trajectories of ethnic segregation in Central European cities.“ Central and Eastern European Migration Review 10(2): 23-47. DOI: 10.17467/ceemr.2021.11. ISSN 2300-1682. Dostupné z: http://ceemr.uw.edu.pl/vol-10-no-2-2021/articles/new-urban-diversity-and-after-economic-downturn-recent-trajectories-ethnic.
Autoři:
Oddělení:
Témata:
bydlení
město a vesnice
migrace a mobilita
občanská společnost
veřejná správa
životní úroveň


Facebook
X
Tweets by SociologickyNewsletter